Indicator bots: RSI, MACD and Bollinger Bands, live inside the candle or on its close?
October 4, 2026

"Buy when RSI drops below 30" sounds like a complete rule. It is not. It leaves out a question that changes when, and sometimes whether, the bot trades: below 30 when? The moment the live price pushes it there, or only when a candle has closed there?
Charting platforms quietly pick an answer for you. A trading bot cannot, because the two answers produce different trades. This guide explains the indicators available in Bitcator, how conditions are built, and the three ways a condition can be evaluated, using a real 15-minute candle from 4 February 2026 where the two answers disagreed.
Building an indicator condition
An indicator condition has four parts: a source, an operator, a target and a timeframe.
Sources: the live price, a candle close, or an indicator line: MA, EMA, DEMA, RSI, MFI, MACD, Bollinger Bands, Stochastic, CCI, AlphaTrend and TDI.
Operators: crosses up, crosses down, is above, is below.
Targets: a fixed value (RSI 30, CCI −100), or another line (MACD against its signal line, price against the lower Bollinger Band, a fast MA against a slow MA).
Timeframes: 1m, 3m, 5m, 15m, 30m, 1h, 4h and 1d, chosen per condition.
All conditions in a list must be true at the same time (AND). Entry, exit and stop each have their own list. Three rules shape how they behave:
Exit conditions only fire in profit. An indicator exit closes the trade only when it is in profit after fees. It is a way to take profit, not a second stop.
Stop conditions have no profit requirement. If you want an indicator to cut a losing trade, put it in the stop section.
Indicators read the deepest market. Indicator values are computed from the pair's most liquid exchange, while orders, targets and stops use your own exchange's price. If the two prices drift apart by more than a set amount (1% by default), new entries pause until they converge; exits and stops keep running.
Three classic setups
RSI mean reversion: RSI(14) on 15m crosses down 30 as the entry; take profit as a percentage, or RSI crosses up 70 as an indicator exit.
MACD momentum: MACD crosses up its signal line on 1h to enter; MACD crosses down the signal to exit while in profit.
Bollinger Band touch: price is below the lower Bollinger Band on 15m to enter, combined with RSI below 35 to avoid buying every small dip. Bitcator's default band uses period 14 and a 0.5 standard-deviation width, which is much narrower than the classic 20/2; on Premium you can set the parameters yourself.
Live inside the candle, or on its close?
Every condition has an evaluation mode:
Live (intrabar): the forming candle is included. The bot rebuilds it with the current price and recalculates the indicator, so a condition can become true in the middle of a candle. Fastest reaction; but a condition that is true now may no longer be true when the candle closes.
On bar close: only closed candles count. The signal never disappears afterwards, but it arrives only when the candle closes, up to one full candle later.
Live with a confirmation time: the condition must hold without a break for a set time (up to an hour) before the bot acts. Brief touches are filtered out; sustained moves still trigger before the close.
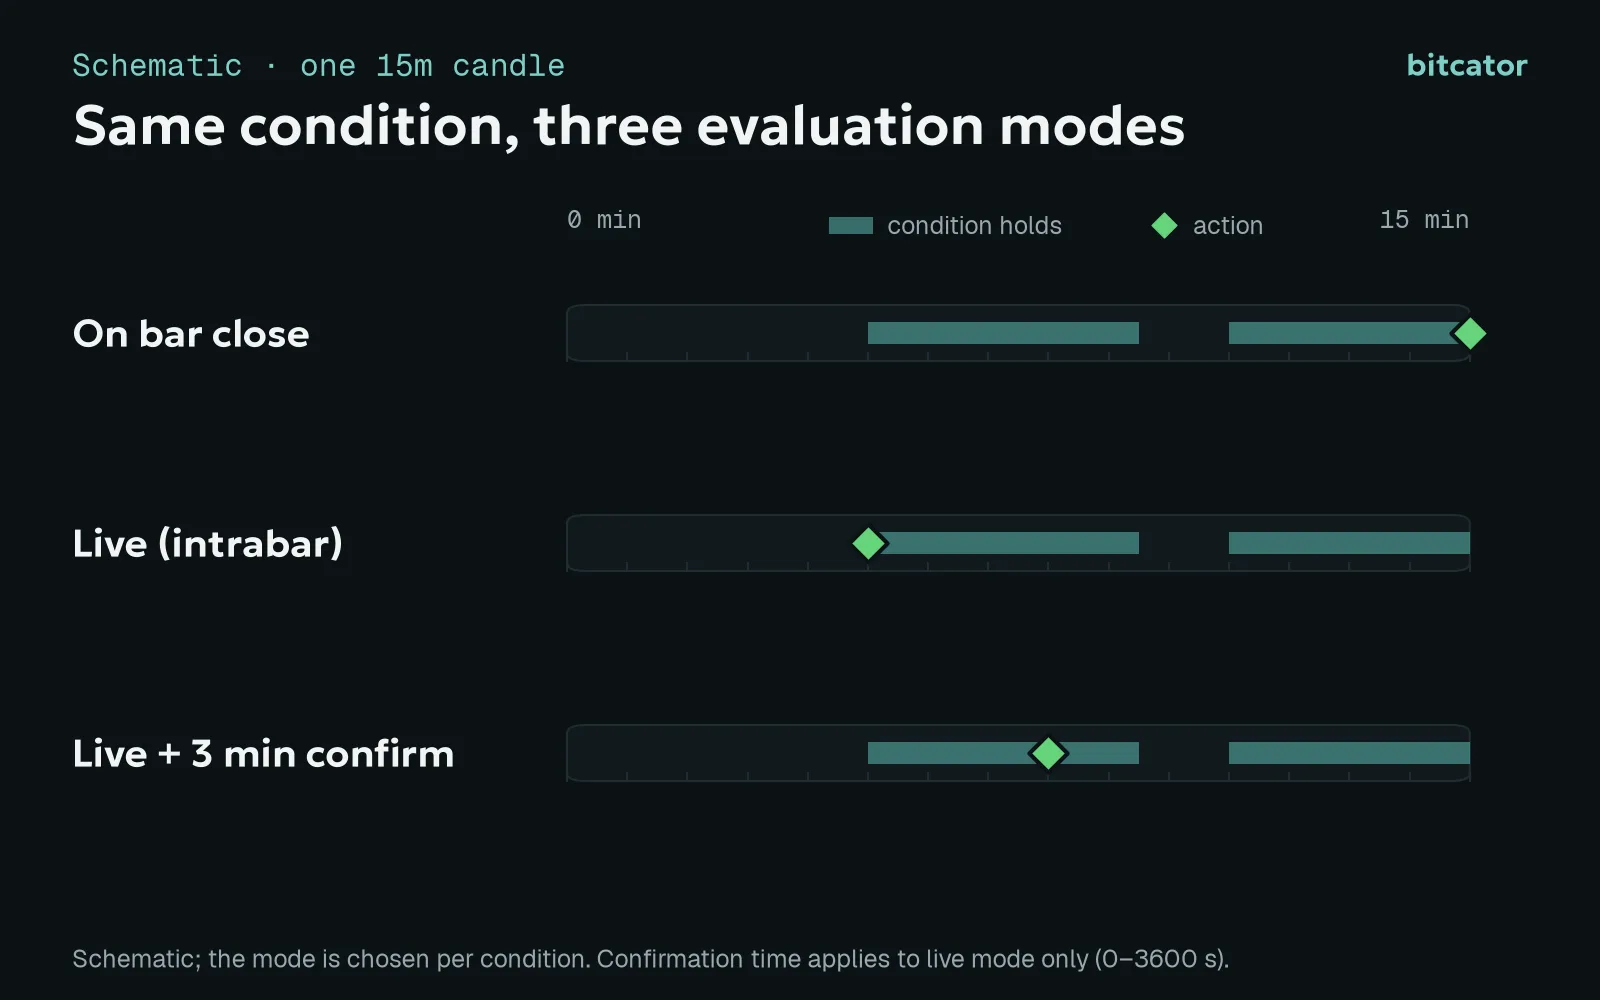
Schematic. The mode is chosen per condition.
A real example: 4 February 2026, 17:00 UTC
On the afternoon of 4 February 2026 BTC was sliding, and the 15-minute RSI(14) was hovering just above 30. The candle that opened at 17:00 UTC is a textbook case:
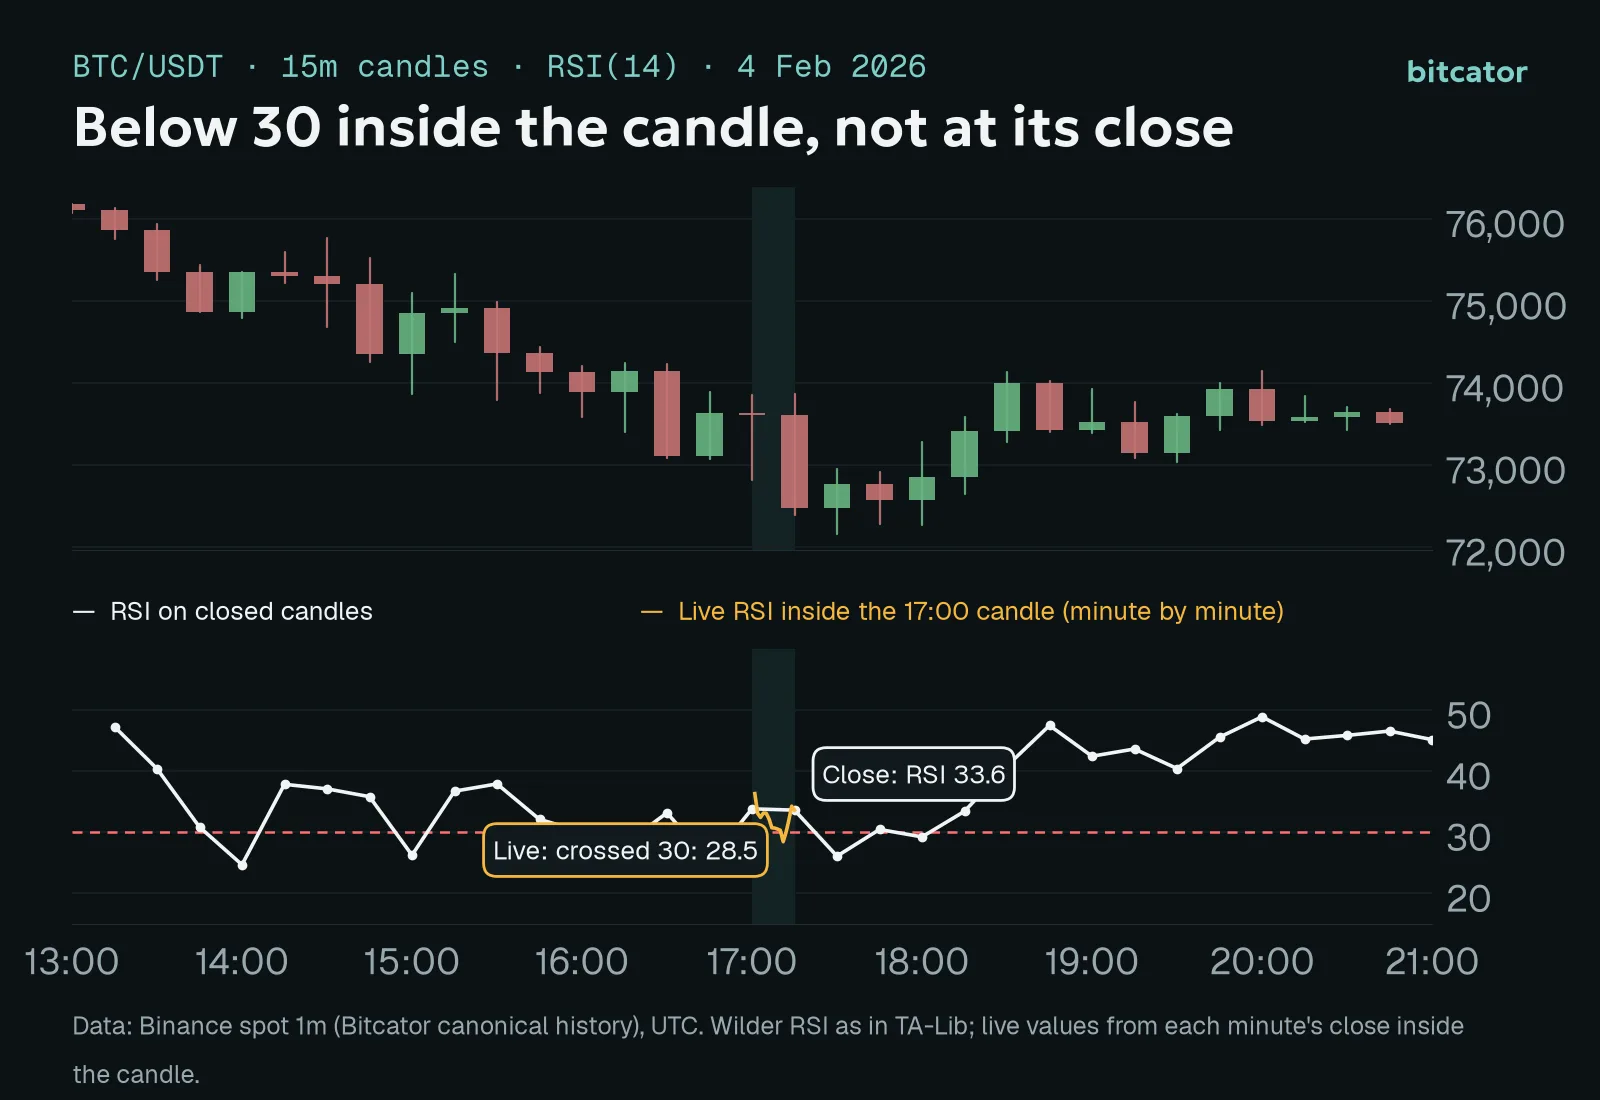
Real candles; live RSI from each minute's close inside the candle. Times in UTC.
The previous candle closed with RSI at 33.8.
Inside the 17:00 candle the price slid to about 72,840 and, at 17:11, the live RSI read 28.5: below 30.
By 17:15 the price had bounced, and the candle closed with RSI at 33.6. On closed candles, RSI never crossed 30 in this candle.
Now the same rule, RSI(14) on 15m crosses down 30, in each mode:
Live: the entry fires at about 17:11, near 72,840. A minute later the condition is gone, but the trade is open.
On bar close: nothing happens at 17:15. The next candle keeps falling and closes at 72,474 with RSI 26.1, so the entry fires at the 17:30 close.
Live with a 3-minute confirmation: the 17:11 dip lasted about one minute, so it is ignored. In the next candle the live RSI went below 30 at 17:21 and stayed there, so the entry fires a few minutes later, before the 17:30 close.
None of these is "correct". Live reacted first and caught a level that closed-candle traders never saw; on bar close waited and bought lower this time; the confirmation time sat in between. On another day the order of prices would be different. The point is that the mode is part of the strategy, and it should be chosen and tested, not inherited.
Which mode for which rule
Crossings of fast-moving lines (RSI and Stochastic on low timeframes) flicker most inside a candle. Use on bar close or a confirmation time if you want the signal to mean what it means on the chart.
Level conditions that act as filters (price above the 200 EMA on 4h) change slowly. Live is fine and avoids waiting up to four hours for a close.
Exits in live mode react sooner; since an indicator exit only fires in profit, the cost of an early exit is a smaller gain, not a loss.
Stops in live mode react to intrabar spikes. If a stop condition keeps firing on wicks, add a confirmation time or switch it to bar close.
Testing it properly
Backtests support all three modes. Live conditions are recalculated at every 1-minute close, so a live signal can be up to a minute later than it would be in a running bot, and confirmation times are rounded up to whole minutes. The result page notes when this applies. Two practical habits:
Run the same strategy in both modes and compare the trade count. If live produces far more trades than on bar close, many of your signals are intrabar noise.
Keep the defaults until you have a reason. On Starter and Advanced, indicators use their default parameters (for example RSI 14 and MACD 12/26/9). Tuning parameters is exactly where overfitting starts, so change them only with a reason you could explain before seeing the backtest.
Indicator conditions are available from the Starter plan; custom indicator parameters on Premium.
This article is for educational purposes only and is not investment advice. Trading crypto assets carries a high risk of loss. Past results, including backtests and the example above, do not guarantee future results.