Grid bots: how to pick the price range and the number of grids
November 20, 2026
A grid bot is one of the easiest strategies to explain and one of the easiest to set up badly. You pick a price range, the bot slices it into steps, and then it does the same boring thing all day: buy a little lower, sell a little higher, repeat. Every completed buy-and-sell leaves a small profit. When the price wanders up and down inside the range, those small profits add up.
That is the good news. The catch is that two numbers you choose before you start, the range and the number of grids, decide almost everything. This guide explains what each one does, shows the fee arithmetic that limits how fine a grid can be, and replays the same grid on three real 30-day stretches of BTC/USDT: a sideways month, a rally and a sell-off. It is meant to help you decide, not to make grids look better than they are.
How a grid bot works
Say the range is 60,000 to 66,000 and you choose 6 grids. The bot draws seven price levels, 1,000 apart, and treats each gap between two neighbouring levels as one interval. Each interval always has exactly one order waiting:
An interval that is empty waits to buy at its lower level.
An interval that holds coins waits to sell at its upper level.
When a buy fills, the order for that interval flips to a sell one step higher. When that sell fills, the interval is empty again and the buy is placed again. One buy plus one sell is a round trip, and each round trip pays the difference between the two levels, minus fees.
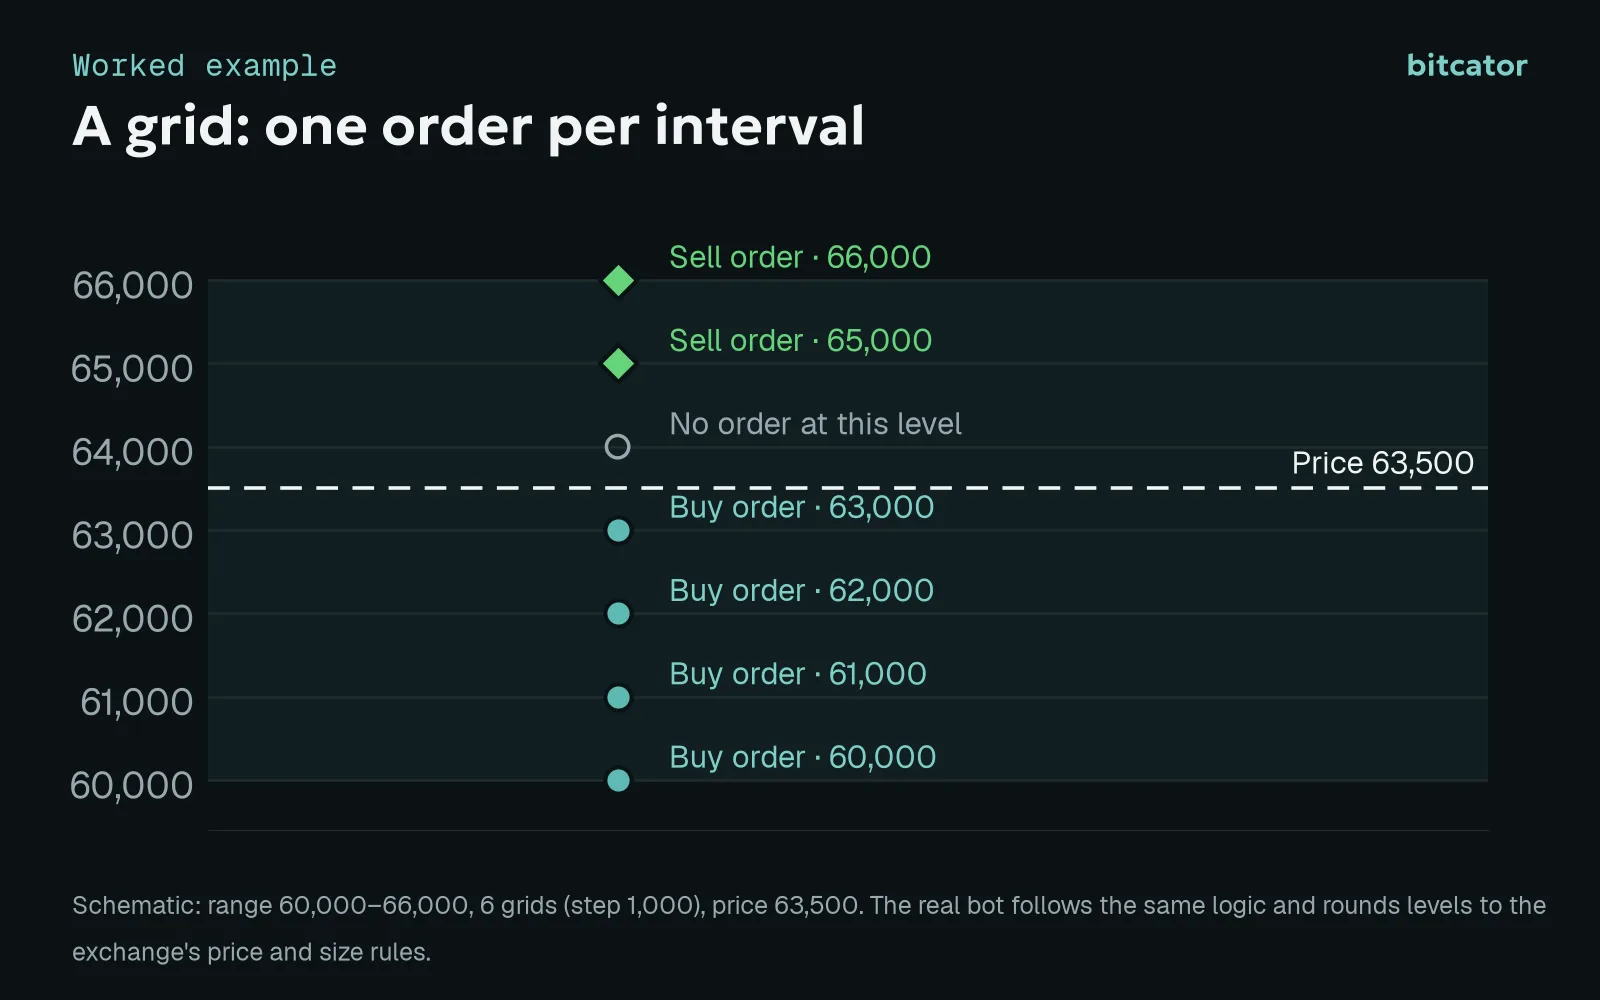
_Worked example, not real market data. Intervals above the price already hold coins, so they wait to sell; intervals below wait to buy._
When the bot starts, it buys the coins for the intervals that lie above the current price in one market order, so that those intervals can sell as the price rises. The rest of your money waits in the buy orders below the price. If the price is outside your range when you start, the bot simply waits until it comes inside.
In Bitcator the same rules run in a backtest, in paper mode and live, so you can try a range on past data and then on live prices with virtual money before using real money.
Choosing the range
The range is your bet on where the price will spend its time. Three things follow from it.
The range has to match how the coin really behaves. Look at the chart for the last weeks or months and ask where the price has actually lived. A range hugging today's price is narrow, so each step can be small and round trips come often, but the price leaves it easily. A wide range survives bigger swings but spreads your money thinly: with the same budget, each step is smaller or each order is.
Money is spread across the range. With the total-investment option, your amount is divided so that every interval gets an equal-sized order. The grid builder checks that each order is large enough: roughly 5 USDT or more per order, and above the exchange minimum for the pair. A wide range with many grids and a small budget will be rejected for exactly this reason.
The range has limits. The top of the range can be at most 100 times the bottom, and the price steps have to be at least 0.1%.
You also choose how the levels are spaced. Arithmetic spacing keeps the price gap equal, say 1,000 between every level. Geometric spacing keeps the percentage gap equal, so each step is the same percentage of the price. For a narrow range the two are almost identical. For a wide range, geometric spacing keeps your profit per round trip similar at the bottom and at the top.
Choosing the number of grids
More grids means smaller steps, so the price crosses a level more often and the bot trades more. Fewer grids means bigger steps and fewer trades. That sounds like "more is better", but the fees push back.
Every order on an exchange costs a fee. In the example below we use 0.1% per order; your exchange and fee tier may differ. A round trip contains two orders, so it pays about 0.2% in total. If the step between two levels is smaller than that, every round trip loses money even though the bot did exactly what you asked.
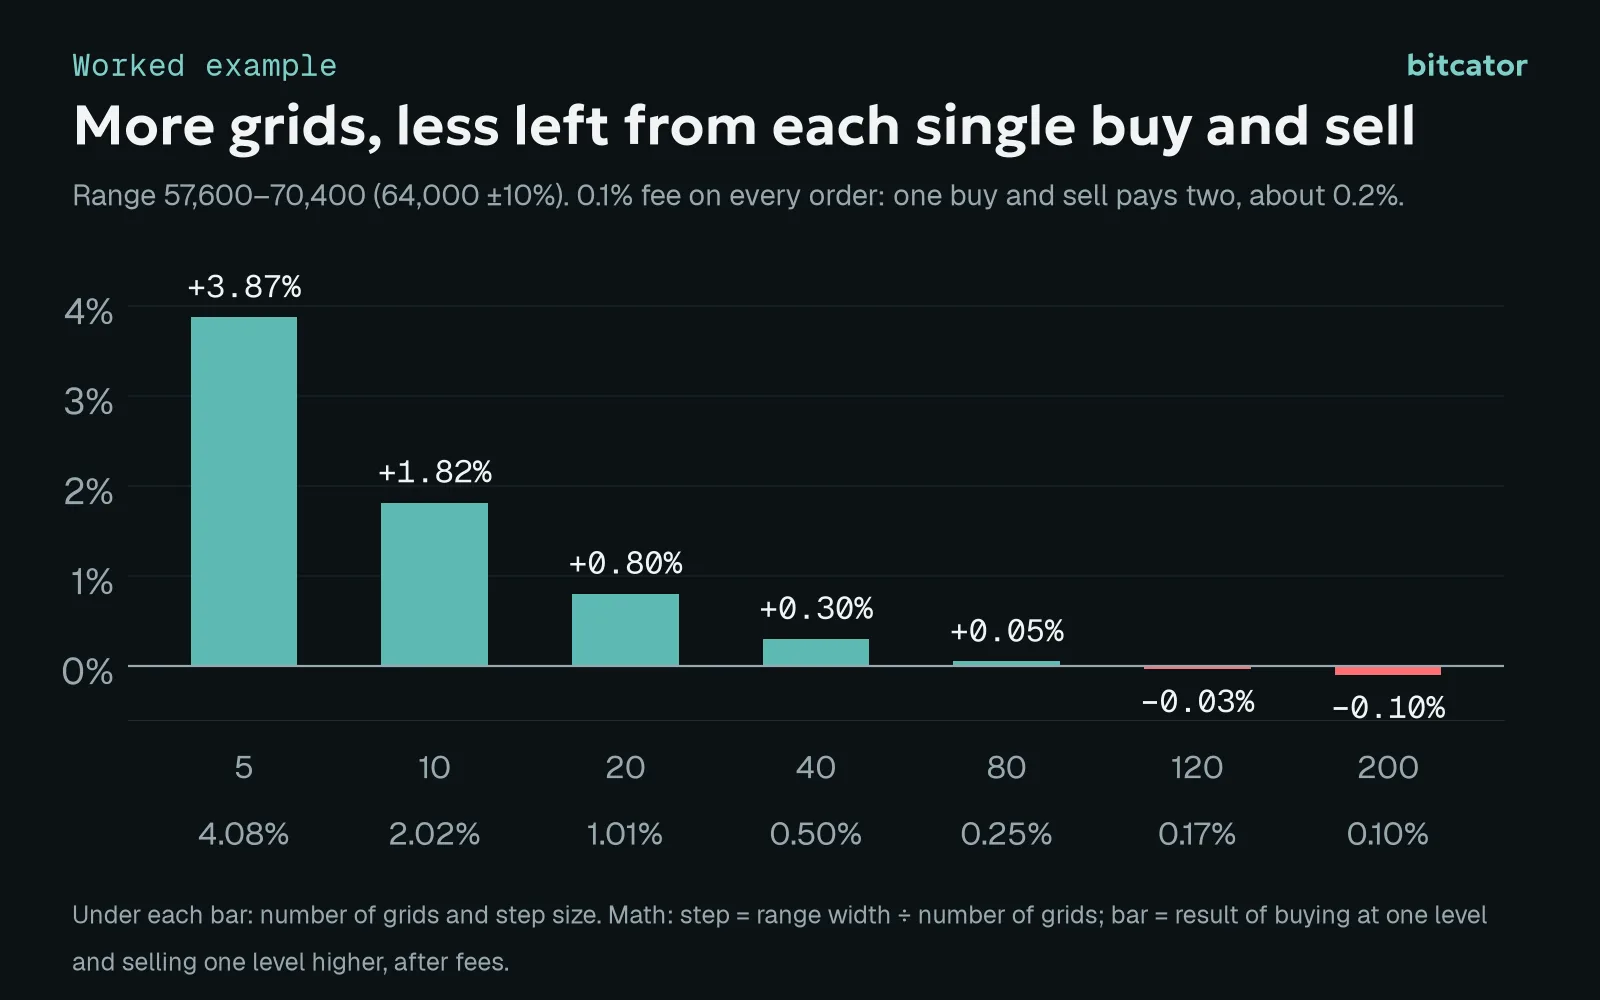
_Worked example: range 57,600 to 70,400 (64,000 ±10%), arithmetic spacing, 0.1% fee per order. Step = range width divided by the number of grids._
Read the chart from left to right. With 5 grids each step is about 4%, and a round trip leaves 3.87% after fees. With 20 grids it is about 1% and 0.80% is left. With 80 grids, a step of 0.25% leaves only 0.05%. Beyond about 100 grids the step is smaller than the fees and each round trip is a small loss.
So the trade-off is simple. Fewer grids earn more per trade but trade less often; more grids trade often but keep less of each one. A practical way to decide is to look at how far the price usually moves in a day and choose a step comfortably above the fees, say 0.5% to 1% for a first grid, rather than the maximum the builder allows. Exchanges also limit how many open orders a pair can have, which is another reason why very high grid counts are often impractical. Bitcator checks this limit for you.
The same grid in three real months
To see how much the market matters, we ran one grid on three real 30-day windows of BTC/USDT daily candles from Bitcator's history. In every window the range is the start price ±10%, with 20 grids, 1,000 USDT and a 0.1% fee per order.
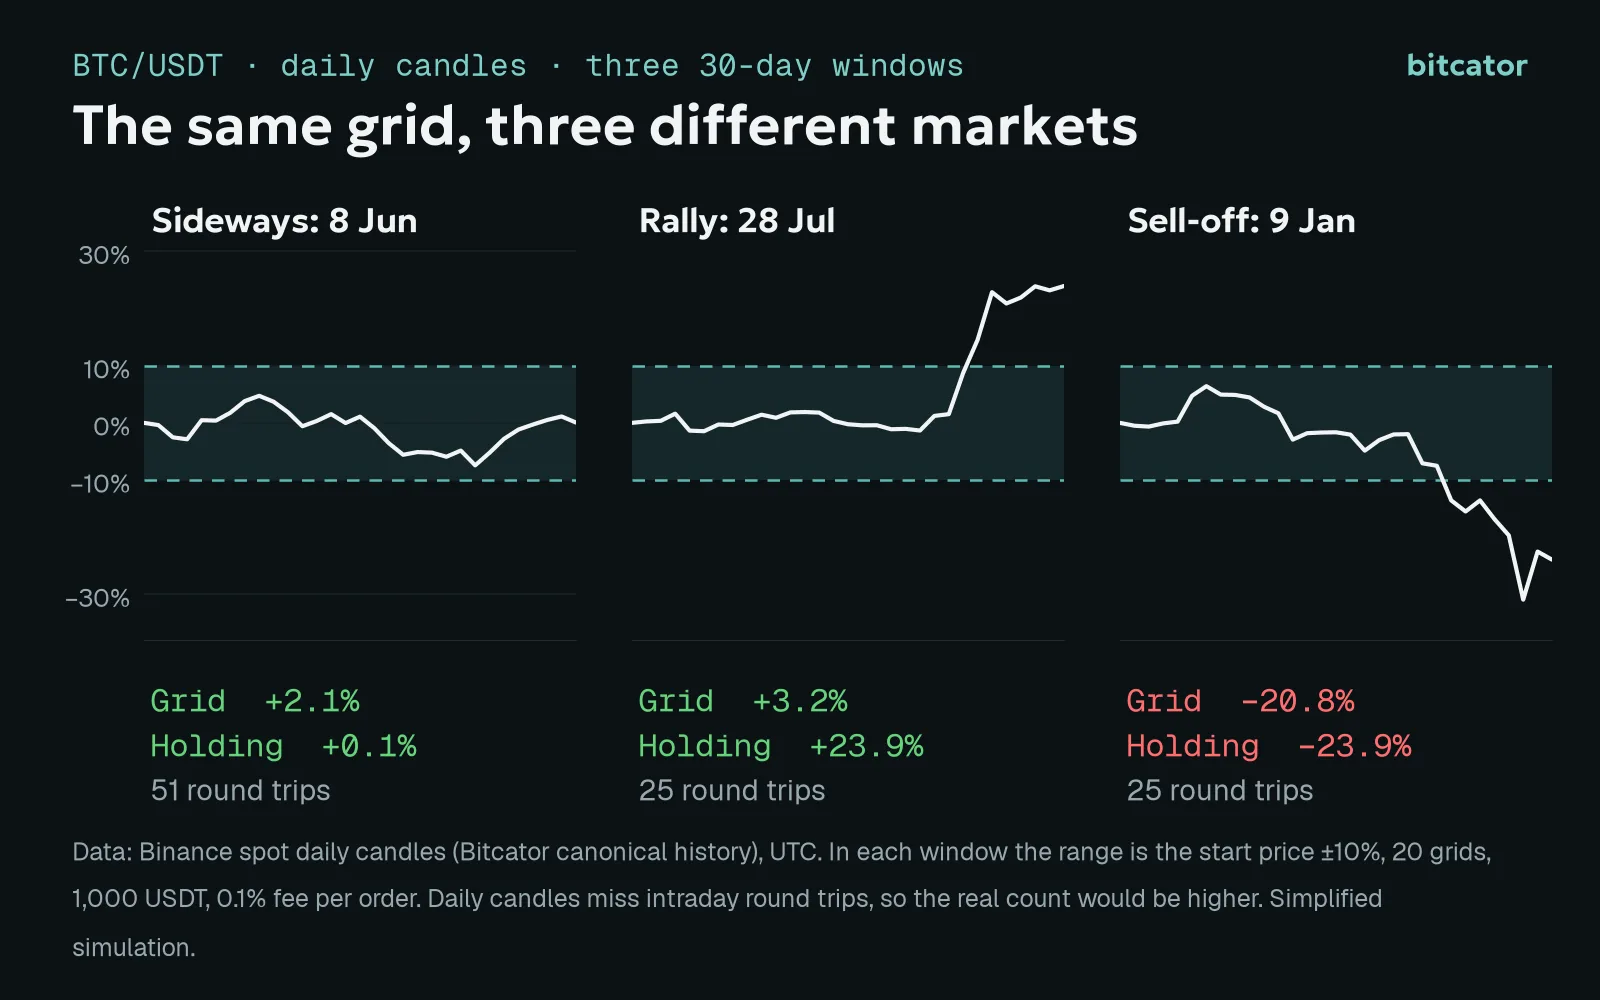
_Simplified simulation on Binance spot daily candles (Bitcator's canonical history), UTC. Daily candles miss intraday round trips, so the real number of round trips would be higher._
Sideways, from 8 June 2026. The price stayed between about −9% and +6% of where it started. The grid completed 51 round trips and finished the month at +2.1%, while simply holding the coins ended at +0.1%. This is the market a grid is made for: nothing much happens, and the grid collects the small moves anyway.
Rally, from 28 July 2026. The price rose past the top of the range. Every coin was sold on the way up, the grid had nothing left to trade and ended at +3.2%, while holding made +23.9%. Nothing went wrong; the bot just earned only inside the range and sat in cash while the price ran away.
Sell-off, from 9 January 2026. The price fell below the bottom of the range. The grid bought at every level on the way down, ended the month holding coins in all 20 intervals and finished at −20.8%, compared with −23.9% for holding. The small round-trip profits softened the fall slightly but did not come close to covering it.
The lesson is not that grids are good or bad. A grid earns from movement that returns to where it started and is a poor fit for a long, one-way move. If you expect a trend, a different bot type is usually a better tool.
What to set for the moments the price leaves the range
You can decide in advance what the grid should do when the market breaks out.
Stop-loss and take-profit. Both are measured against your investment: the grid stops when the total result, including the coins it still holds, falls to −x% or rises to +x%. You can also tell it to sell the coins when it stops; otherwise they stay in your account.
Leaving the range. With the default setting the bot keeps its orders and waits for the price to return. You can instead make it stop if the price stays outside the range for 60 seconds.
Trailing. Turn on trailing up or trailing down and the range slides toward the price, one grid at a time, instead of letting the price leave. You can cap how far it may slide. Sliding down means selling the top interval at a loss to make room, so use the cap.
On perpetual futures a grid can also be long, short or neutral, with leverage. Leverage makes everything above sharper, and the builder refuses a setup in which the worst case would liquidate the position inside your range.
Two-orders mode for big grids
Normally every interval has its order sitting on the exchange, so a 100-grid bot has around 100 open orders. If you prefer fewer, turn on two-orders mode. Only the nearest buy and the nearest sell wait on the exchange; when one fills, the bot cancels and places the next pair. The levels, sizes, fees and profit are the same as in a normal grid, and the exchange's open-order cap does not apply. Your money for later buys must still be in the account, since the bot buys lower as the price falls.
A checklist before you start a grid
Draw the range from history, not hope. Look at where the coin has lived over the last weeks and decide how much of a break-out you can live with.
Pick a step above the fees. Subtract about 0.2% (0.1% per order, check your exchange) from your step. If little is left, use fewer grids.
Check the order size. Total money divided by the number of grids should clear the minimum order with room to spare.
Decide the exit before you start. Set a stop-loss, and decide whether leaving the range should wait, stop or slide the range.
Backtest it, then paper-trade it. Run the grid on a past month that looks like what you expect, and on a month that does not.
Size the whole thing as money you can leave in a falling position. In a sell-off the grid ends up holding the coin.
_This article is for educational purposes only and is not investment advice. Trading crypto assets carries a high risk of loss. Past results, including backtests and the simulations above, do not guarantee future results._